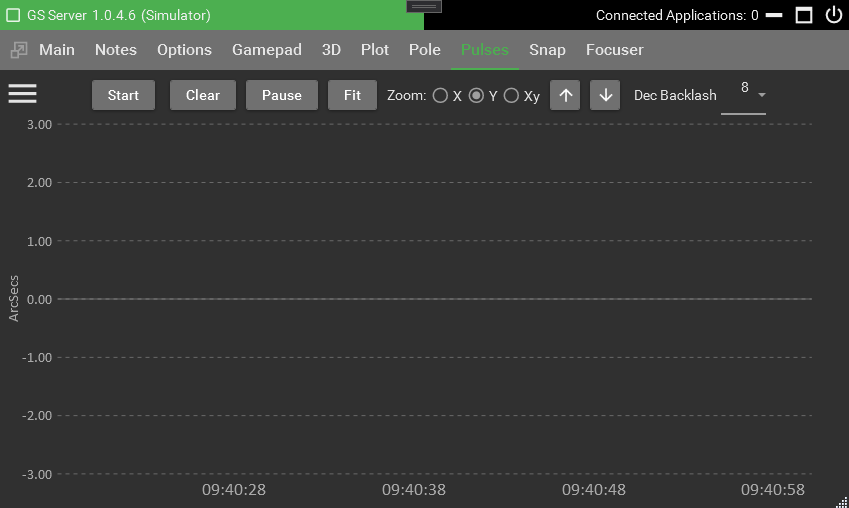
Pulses are captured from guiding applications like PHD2 which will send the guiding corrections to the driver in the form of individual pulses. These pulses can be captured and displayed here to see the performance of guiding for the mount.
GS ChartViewer – ChartViewer is another program packaged with GS that allow external viewing of the Pulses Logs. This allows logs to be viewed by others that have the ChartViewer program. Locate GS.ChartViewer.exe in the install directory.
Start – Starts and stops the chart. Pulse logs are automatically saved to the documents area.
Clear – Removes any drawings on the screen only
Pause – Stops the timeline from auto scrolling and allows the chart to be panned and zoomed.
Fit – Readjusts the chart to fit the screen using the selected scale.
Zoom – Changes the mouse and arrow behaviors. Use the mouse wheel or arrow key buttons.
Dec Backlash – Allows adjusting the Dec backlash while watching guiding live. Refer to the section Backlash Compensate.
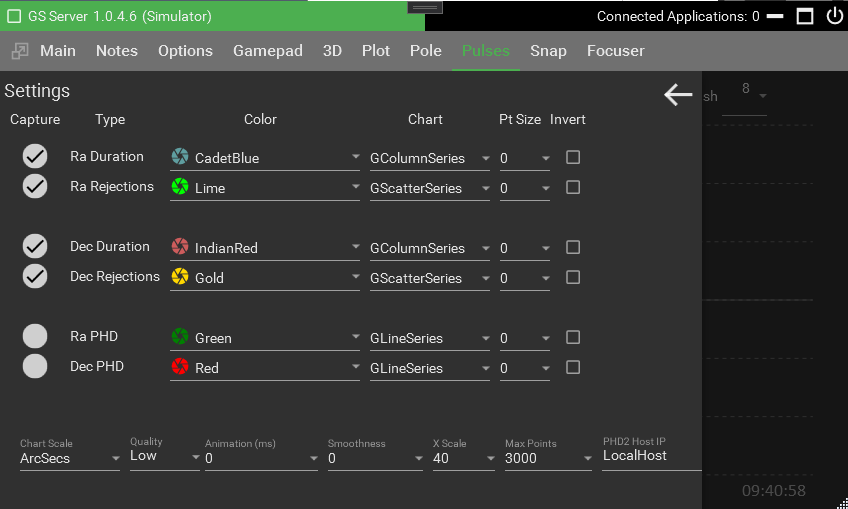
Capture – Check to show and log a series.
Type
- Ra Duration – Normal Ra corrections being process by the driver
- Ra Rejections – Rejected Ra pulses
- Dec Duration – Normal Dec corrections being process by the driver
- Dec Rejections – Rejected Dec pulses
- RA PHD and Dec PHD – Displays the guiding performance from PHD2. If one is checked a connection will be made to the PHD2 server so make sure it’s turned on in the PHD2 settings. The PHD Host IP is also required for the connection to work.
Rejected pulses are pulses that are not accepted to process by the driver and are typically too small. The rejection size is determined by the minimum pulse settings in the Main tab settings. Specific minimum settings are mount specific but typically 20 milliseconds is a good generic setting. If lots of pulses are being rejected you might have to adjust the guiding application or adjust the minimum pulse setting.
Chart – Selects a specific series to show such as Line, Column, Step Line, or Scatter.
Point Size – Some series can show specific points on the chart and this would determine the size.
Invert – Will invert the data so basically it will flip the data from above zero to below zero or visa-versa.
Scale – Scale will determine the Y scaling to be used for all captured items.
Quality – Determines how much detail to show when zoomed out or in. If set to low the farther you zoom out the less detail is shown. The more you zoom in more detail will be shown. Low is the best setting for performance and a higher quality will slow down zooming effects.
Animation – Each series can animate how points are drawn on the screen. Use this in conjunction with smoothness for different effects. Any setting above 0 will affect performance of the chart.
XScale – How many seconds to show on the timeline
Max Point – How many points to keep in the series while the chart is being shown on the screen. Larger settings can affect performance of the chart. This can be useful if you pause the chart and scroll back to view the history.
PHD2 Host IP – IP or host name of the PHD server. This is required if capture is turned on for PHD items. Localhost is the default computer.