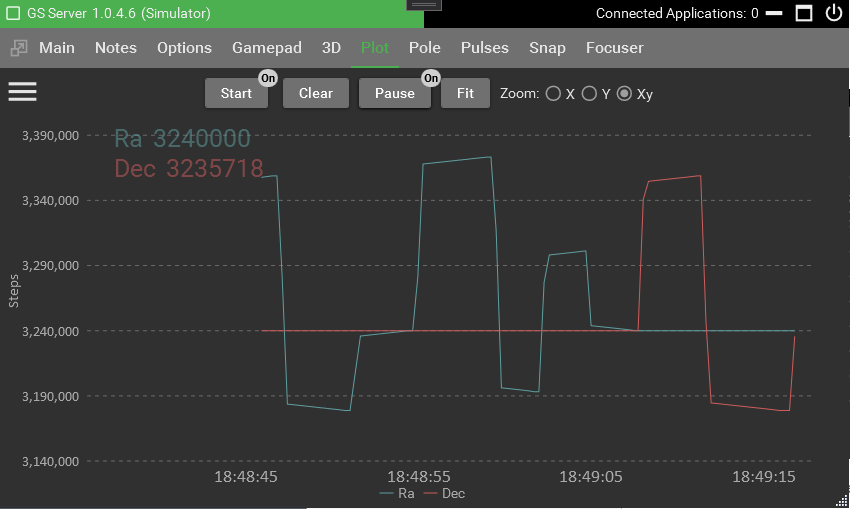
Plot will graphically show the axis positions in real time. Use this to validate certain speeds like tracking rates.
Start – clears the plots and starts a new chart based on the settings.
Clear – removes the current plots from the screen.
Pause – stops the plots from moving forward in time. This allows you to use the mouse to move the chart around.
Fit – Attempts to readjust the plot to fit in the current chart’s Y axis. Using this in conjunction with the zoom options.
Zoom – Changes the mouse and arrow behaviors. Use the mouse wheel or arrow key buttons.
Zero Base Axes – uses zero as the axes starting point rather than the home positions which are typically set at 90/90 degrees.
Y Scale – Display plots in micro steps, arc seconds, or degrees
Zoom Quality – the father zoomed out the less detail is shown. When adjusted higher, more detailed is shown at zoomed out distances. Default is set to Low so you need to zoom in to improve the details. Low is best used for performance reasons.
To validate tracking speeds open the Plot Settings and select RA and set Y-Scale to Arcsecs. Start the mount tracking and then start the plot. The Ra will show the seconds per degree and should match the tracking selected rate. Let the plot run for a few minutes as the longer it runs the more accurate it will be. Doing a goto or slew will average the rate so use the clear to start the plot again.